It’s easy to find articles by self-interested charities, road safety groups, newspapers and other organisations that put a spin on statistics to further their own agendas. Let’s look at the real reasons that cause traffic casualties.
The weather
Good weather increases the likelihood of extra trips which increases exposure. These trips tend to occur outside of rush hour. Good weather increases the number of motorcyclists, cyclists and pedestrians on the road.
Bad weather increases certain types of accidents and decreases other types. Poor conditions reduce visibility on the roads and make driving more treacherous due to ice, water and increased debris on the road. However, as drivers tend to slow down during bad weather, the impact severity is less resulting in generally less severe accidents.
When weather is particularly bad, people postpone journeys or find other means of transport. Postponing journeys means less road traffic. Cyclists, motorcyclists and pedestrians might move to public transport or their own vehicles.
When weather is unpleasant but not really bad, pedestrians, motorcyclists and cyclists move to enclosed methods of transport.
As pedestrians, motorcyclists and cyclists are the most vulnerable road users, when there are less of them around, there is less risk. Plus, if more of them choose cars, this increases congestion and slows traffic down further, reducing the severity of accidents.
A Government report on Report Road Casualties in Great Britain (linked below) states that “bad weather usually results in a reduction of accidents as the reduction in exposure and driving speeds usually outweighs the increased inherent risk of poor road conditions.”
Spring and autumn is when pedestrians, motorcyclists and pedal cyclists will most frequently decide on their mode of transport by looking out of the window to see what the weather is doing.
2014 had more casualties than 2013 in part because 2014 was much warmer overall. The same trend happened in Germany.
Economic recessions
During economic recessions there is less traffic on the road, less freight movements and people take less journeys. These reduce the interactions of vehicles on the road and therefore the risk.
Drivers who continue to drive often drive slightly more slowly to conserve fuel. Slower speeds means less severity in accidents and less risk of an accident.
Volume of traffic
More people travelling means more risk of having an accident. If these people are travelling using higher risk modes such as cycling or walking then accident rates will increase. Cycle lanes reduce the likelihood of cyclists being in accidents. Pedestrians tend to be the cause of car vs pedestrian accidents through inattention and risk-taking.
To make an effective comparison we need to look at the accident rate per billion vehicle miles driven. The fatality rate has fallen almost every year since 1949 from 165 deaths per BVM down to 5.6 deaths per BVM in 2013. 2014’s figure was 5.7 deaths per BVM. This corresponded to 62 more deaths. More than three-quarters of these were pedestrians.
Vehicle technology
Automatic braking technology is gradually filtering its way into the vehicle fleet. While it’s in small numbers at the moment it will only grow in its significance as the vehicles can brake much more quickly than a human in response to, for example, a child running out into the road.
This article (with videos) shows you some of the amazing technology that’s being included in new cars.
Road design
Improvements in road design reduce the likelihood of crashes. This includes making sure that the road is in good condition, is easy to read by drivers, separates vulnerable users where possible, has appropriate speed limits, and so on. There’s a constant program of improvement.
Appropriate speeds
A car braking from 30mph will still be doing 24mph when a car braking from 20mph has stopped. This kind of basic physics means that if vehicles are moving more slowly, the chances of having a severe accident are decreased.
Examples of public relations spin that you should take care with
20mph zones
It was reported that there was a ‘massive’ increase in the number of accidents in 20mph limits. However, many of the articles didn’t mention that there was also a massive increase in the number of roads with a 20mph speed limit, or that there was a corresponding drop in accidents on roads with a limit of 30mph and 40mph as they were changed into roads of 20mph and 30mph. For example, the Institute of Advanced Motorists put out a press release saying that the increase was 367% without mentioning the increase in the number of 20mph zones.
Looking solely at the overall figures
The majority of the increase in deaths between 2013 and 2014 came in one age group: over 60 years old.
The majority increase in serious injuries was motorcyclists (which correlates with the warmer weather).
One-off outlier events that cause an unnatural blip: for example, the bin lorry crash in Glasgow on December 22, 2014 caused six pedestrian deaths, six pedestrian casualties and five casualties in other vehicles. This one accident added 17 to the total.
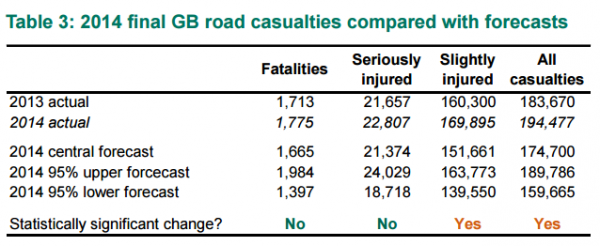
The Department found that the overall increase in fatalities or seriously injured between 2013 and 2014 is not statistically significant, i.e. it is down to natural variations. It is still the third lowest after 2012 and 2013 with 45% fewer fatalities than 2005, therefore you shouldn’t believe the spin – just look at the facts.
Read the full government report here.
Darren has owned several companies in the automotive, advertising and education industries. He has run driving theory educational websites since 2010.